Chart.js 介绍chart.js 是为设计和开发人员准备的简单、灵活的 Java 图表工具。 
Chart.js图表和ThingJS结合方法
有ThingJS平台目前只有在线开发的方式,故需要通过html5的postMessage 消息机制来实现图标和ThingJS中的3D场景交互。 Chart.js 图表实现chartjs主要通过配置来实现图标。 chartjs实现饼图的代码如下: - var ctx = document.getElementById('myChart');
- var myChart = new Chart(ctx, {
-
- type: 'pie',
- data: {
- labels: ['叉车', '轿车', '警车', '皮卡'],
- datasets: [{
- label: '# of Votes',
- data: [11964, 18799, 51966, 35876],
- backgroundColor: [
- 'rgba(255, 99, 132, 0.9)',
- 'rgba(54, 162, 235, 0.9)',
- 'rgba(255, 206, 86, 0.9)',
- 'rgba(75, 192, 192, 0.9)',
- ],
- borderColor: [
- 'rgba(255, 99, 132, 1)',
- 'rgba(54, 162, 235, 1)',
- 'rgba(255, 206, 86, 1)',
- 'rgba(75, 192, 192, 1)',
- ],
- borderWidth: 1
- }]
- },
- options: {
- title: { //标题 display: true,
- text: '车辆销售额饼图',
- fontColor: "#00f",
- },
- scales: {
- yAxes: [{
- ticks: {
- beginAtZero: true
- }
- }]
- },
- }
- });
画出图表如下图 
ThingJS 3D场景实现然后在ThingJS平台搭建一个车辆的场景如下图:
 Chartjs图表和ThingJS通讯- events: ['mousemove'],
- onHover: function (d, i) {
- if (i.length > 0) {
- console.log(i[0]._index);
- iframeDom.contentWindow.postMessage(-1, '*');
- iframeDom.contentWindow.postMessage(i[0]._index, '*');
- } else {
- console.log(-1);
- iframeDom.contentWindow.postMessage(-1, '*');
- }
- }
ThingJS接收到消息对3d对象勾边 - // 接收iframe页面传送的数据
- window.addEventListener('message', function (e) {
- var data = e.data;
- if (data == -1) {
- var selector = app.query('*');
- selector.style.outlineColor = null;
- } else {
- var selector = app.query('#1' + data);
- selector.style.outlineColor = '#ff0000';
- }
- })
最后完整代码如下: - <!DOCTYPE html>
- <html>
-
- <head>
- <meta charset="UTF-8">
- </head>
-
- <body style="margin: 0px">
- <!-- <div id="container" style="position:absolute; z-index: 2; margin: 15px"></div> -->
- <div id="canvas-holder" style="position:absolute; z-index: 2; margin: 15px; width: 30%;">
- <canvas id="myChart"></canvas>
- </div>
-
- <iframe id='I0' style="position:absolute; width: 100%; height: 100%;"
- src='https://www.thingjs.com/guide/sampleindex.html?m=oLX7p04daC2OdoZCbP6VihD_0XCo/01E401B901B0201E801BD01A6.js?n=7027'></iframe>
-
- <script src='js/Chart.min.js'></script>
- <script>
- var iframeDom = document.getElementById('I0');
- var ctx = document.getElementById('myChart');
- var myChart = new Chart(ctx, {
-
- type: 'pie',
- data: {
- labels: ['叉车', '轿车', '警车', '皮卡'],
- datasets: [{
- label: '# of Votes',
- data: [11964, 18799, 51966, 35876],
- backgroundColor: [
- 'rgba(255, 99, 132, 0.9)',
- 'rgba(54, 162, 235, 0.9)',
- 'rgba(255, 206, 86, 0.9)',
- 'rgba(75, 192, 192, 0.9)',
- ],
- borderColor: [
- 'rgba(255, 99, 132, 1)',
- 'rgba(54, 162, 235, 1)',
- 'rgba(255, 206, 86, 1)',
- 'rgba(75, 192, 192, 1)',
- ],
- borderWidth: 1
- }]
- },
- options: {
- title: { //标题
- display: true,
- text: '车辆销售额饼图',
- fontColor: "#00f",
- },
- scales: {
- yAxes: [{
- ticks: {
- beginAtZero: true
- }
- }]
- },
- events: ['mousemove'],
- onHover: function (d, i) {
- if (i.length > 0) {
- console.log(i[0]._index);
- iframeDom.contentWindow.postMessage(-1, '*');
- iframeDom.contentWindow.postMessage(i[0]._index, '*');
- } else {
- console.log(-1);
- iframeDom.contentWindow.postMessage(-1, '*');
- }
- }
- }
- });
-
- </script>
- </body>
-
- </html>
完整的ThingJS代码如下: - var app = new THING.App({
- // 场景地址
- "url": "https://www.thingjs.com/./client/ThingJS/11606/20190126172532891305936",
- //背景设置
- "skyBox": "BlueSky"
- });
-
- // 接收iframe页面传送的数据
- window.addEventListener('message', function (e) {
- var data = e.data;
- if (data == -1) {
- var selector = app.query('*');
- selector.style.outlineColor = null;
- } else {
- var selector = app.query('#1' + data);
- selector.style.outlineColor = '#ff0000';
- }
- })
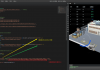
完整效果图如下:

|