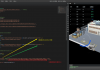
分享
查看: 2603|回复: 0

[分享] quickchart中的echarts图表如何修改样式

[复制链接]

quickchart中的echarts图表如何修改样式

发表于 2023-3-13 17:05:52 来自 分享 只看大图 阅读模式 倒序浏览
zzv_icon2603 zzr_icon0 查看全部
quickchart中的echarts图表如何修改样式

以该图左下方的图表为例,进行修改
(1)获取到对应的dom元素
quickchart中的echarts图表如何修改样式
编辑环境下拿到对应的组件名之后即可通过代码获取
  1.   var dom = $('div[data-v-alias=right01_item06_echarts01]div div')[0]
复制代码
(2)将修改的options样式拿到,可在此进行编辑修改
quickchart中的echarts图表如何修改样式
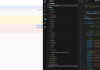
(3)引入echarts,将刚刚修改好的options粘贴到代码中,获取dom元素修改echarts图表样式
//这里引入的是官方资源,也可以自行下载资源上传引入
quickchart中的echarts图表如何修改样式
  1. var dom = $('div[data-v-alias=right01_item06_echarts01]div div')[0]
  2.     // echarts 初始化
  3.     var bottomCharts = window.echarts.init(dom);
  4.     option = {
  5.         tooltip: {
  6.             trigger: 'axis',
  7.             axisPointer: {
  8.                 type: 'shadow'
  9.             },
  10.             backgroundColor: 'rgba(233, 24, 48, 0.5)',
  11.             borderColor: 'rgba(233, 253, 238, 0.4)',
  12.             textStyle: {
  13.                 color: '#CFE3FC',
  14.             },
  15.             borderWidth: 1
  16.         },
  17.         grid: {
  18.             left: '10px',
  19.             right: '10px',
  20.             top: '20px',
  21.             bottom: '1px',
  22.             containLabel: true
  23.         },
  24.         toolbox: {
  25.             show: true,
  26.             orient: 'vertical',
  27.             x: 'right',
  28.             y: 'bottom'
  29.         },
  30.         xAxis: [
  31.             {
  32.                 type: 'category',
  33.                 boundaryGap: true,
  34.                 axisTick: {
  35.                     show: false
  36.                 },
  37.                 data: ['A厂区', 'B厂区', 'C厂区', 'D厂区', '1区'],
  38.                 axisLine: {
  39.                     show: true,
  40.                     lineStyle: {
  41.                         color: 'rgba(255,255,255, 1)',
  42.                         opacity: 0.2
  43.                     }
  44.                 },
  45.                 // axisLabel: {
  46.                 //   interval: 0,
  47.                 //   color: 'rgba(255,255,255, 1)',
  48.                 //   fontSize: 11,

  49.                 // }
  50.                 axisLabel: { //  改变x轴字体颜色和大小
  51.                     margin: 6,
  52.                     textStyle: {
  53.                         color: "rgba(255,255,255,1)",
  54.                         fontSize: 11,
  55.                         fontFamily: '青春体',

  56.                     }
  57.                 }
  58.             }
  59.         ],
  60.         yAxis: [
  61.             {
  62.                 type: 'value',
  63.                 axisTick: {
  64.                     show: false
  65.                 },
  66.                 splitNumber: 5,
  67.                 axisLine: {
  68.                     show: true,
  69.                     lineStyle: {
  70.                         color: 'rgba(255,255,255, 0.2)',
  71.                     },
  72.                     //   symbol: ['none', 'arrow'],
  73.                     //   symbolSize: [5, 12],
  74.                     //   symbolOffset: [0, 10]
  75.                 },
  76.                 axisLabel: {
  77.                     interval: 0,
  78.                     color: 'rgba(255,255,255, 1)',
  79.                     fontSize: 9
  80.                 },
  81.                 splitLine: {
  82.                     show: false,
  83.                     lineStyle: {
  84.                         type: 'solid',
  85.                         color: 'rgba(255,255,255, 0.3)',
  86.                         width: 1,
  87.                     }
  88.                 }
  89.             }
  90.         ],
  91.         series: [
  92.             {
  93.                 type: 'bar',
  94.                 yAxisIndex: 0,
  95.                 name: '污水排放量',
  96.                 itemStyle: {
  97.                     normal: {
  98.                         color: new echarts.graphic.LinearGradient(
  99.                             0,
  100.                             0,
  101.                             0,
  102.                             1,
  103.                             [
  104.                                 {
  105.                                     offset: 0,
  106.                                     color: 'rgba(222,199,255, 1)'
  107.                                 },
  108.                                 {
  109.                                     offset: 1,
  110.                                     color: 'rgba(233,199,255, 0)'
  111.                                 }
  112.                             ],
  113.                             false
  114.                         )
  115.                     }
  116.                 },
  117.                 barWidth: 10,
  118.                 barGap: 1,
  119.                 data: [50, 40, 25, 22, 37, 29],
  120.                 label: {
  121.                     normal: {
  122.                         show: true,
  123.                         position: "top",
  124.                         textStyle: {
  125.                             color: 'rgba(0,241,255,1)',
  126.                             fontSize: 14,
  127.                             fontFamily: '青春体',
  128.                             //   padding: [0, 0, 0, 0],
  129.                         },
  130.                     },
  131.                 },
  132.             }
  133.         ]
  134.     }
  135.     bottomCharts.setOption(option);
复制代码
(4)查看修改后效果
quickchart中的echarts图表如何修改样式

avatar
游客~
您需要登录后才可以回帖 登录 | 立即注册

本版积分规则

130700ppkpl8x3t7tt1b1t